

Maths education · graphing tool
Kutupsal Koordinat Atölyesi: Learn Polar Curves by Drawing Them
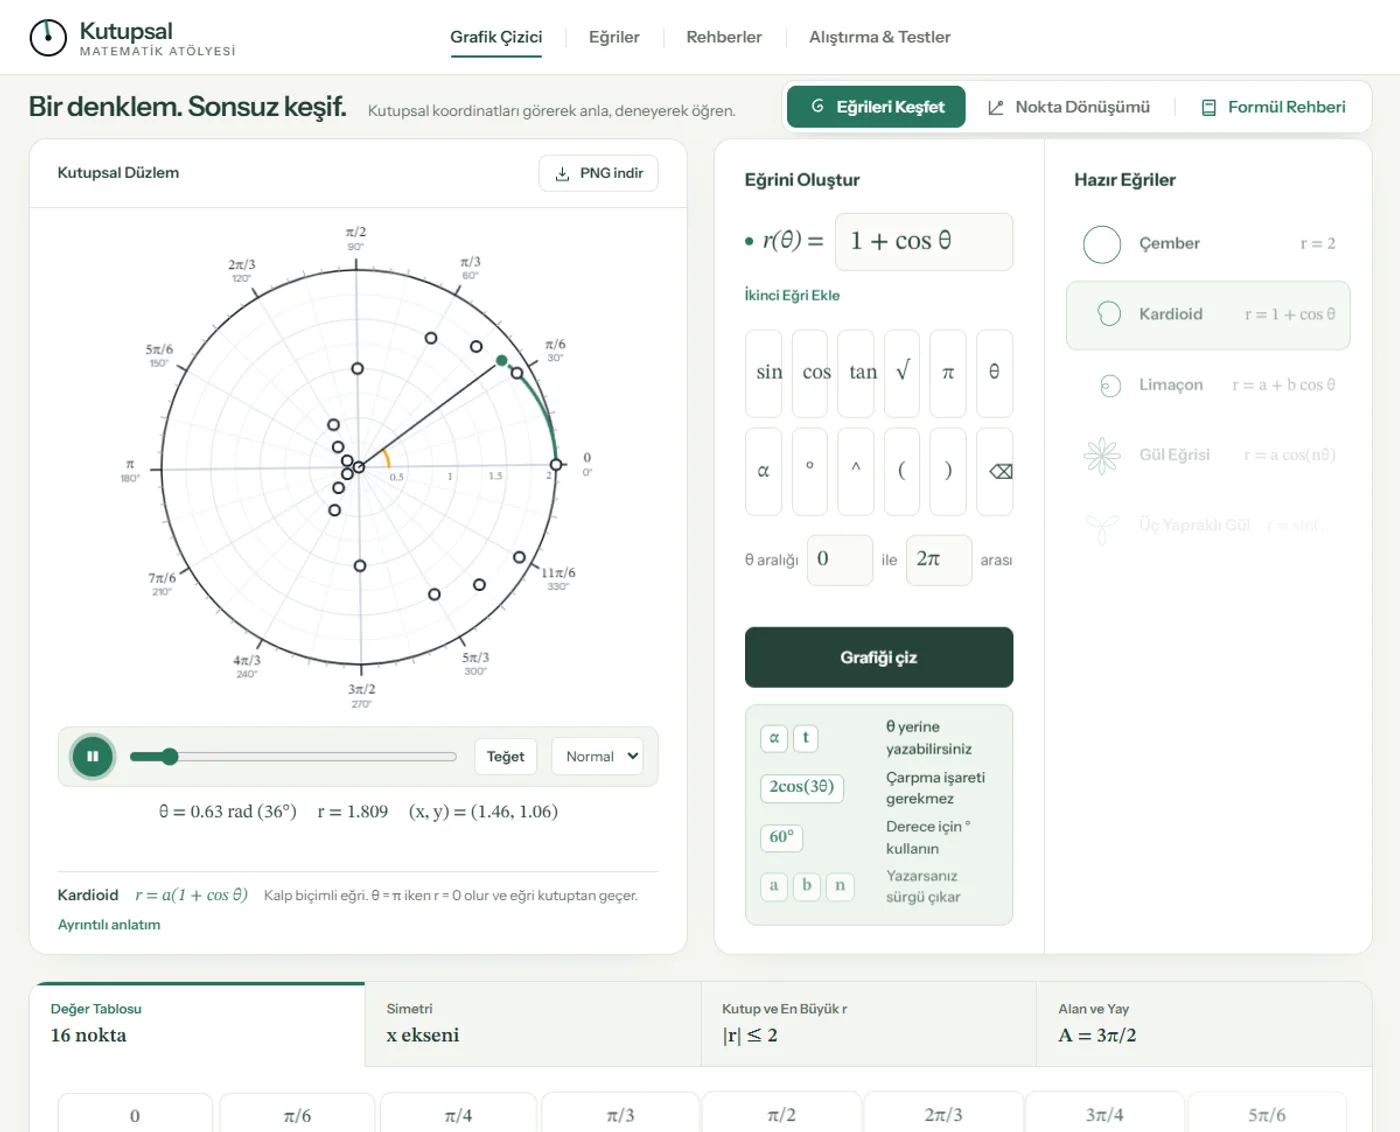
Kutupsal Koordinat Atölyesi is a Turkish-language learning platform that graphs polar equations, converts points between polar and Cartesian coordinates step by step and explains the topic through guides. Graph, table of values, symmetry, area and arc length sit on one screen.
Who is it for?
The situations where this product helps most.
-
High school and university students
Those who want to learn polar coordinates, curves and calculus applications visually
-
Teachers
Those who want to draw polar curves live in class and explain them with tables and symmetry
-
Exam candidates
Those who want to revise conversion, intersections, area and arc length with worked examples
What does it offer?
Details are compiled from the project’s own site; visit the project for the current scope.
- Instant graphs of polar equations with parameters adjustable by sliders
- Adding a second curve to compare two curves on the same plane
- Table of values, symmetry, maximum r, area and arc length for every curve
- Step-by-step conversion of points between polar and Cartesian coordinates
- Nine ready-made curves including circle, cardioid, limaçon, rose, lemniscate and spirals
- Downloading the graph as PNG
Key modules
Graphing tool
Type r(θ), choose the θ range and draw the graph, with the point and tangent shown live
Curve library
Equation, graph and properties of nine curves, from the cardioid to the butterfly curve
Lessons
11 guides from basics to calculus: conversion, symmetry, intersections, tangents, area and arc length
Exercises and tests
Practice questions on polar coordinates
Step by step
How does it work?
From first contact to daily use, the flow moves in four steps.
-
Type
You type an r(θ) equation or pick a ready-made curve
-
Draw
The graph is drawn; the point, tangent and r value move along with θ
-
Examine
You analyse the curve with its table of values, symmetry, area and arc length
-
Practise
You read the guides and test yourself with exercises
Why Kutupsal Koordinat Atölyesi?
What sets the project apart; details are on its own site.
- Explanations and terms fully in Turkish
- Graph, table and formula on the same screen
- A table of values that shows the steps of drawing by hand
- Guides that run from the basics to calculus
Frequently asked questions
Common questions
Short answers here, details on the project’s site. If your question isn’t listed, write to us and we’ll connect you with the team.
Which equations can be graphed?
Polar equations in the form r(θ); sin, cos, tan, roots, powers and π are supported. No multiplication sign is needed, ° can be used for degrees, and typing letters such as a, b or n adds a slider.
How does polar–Cartesian conversion work?
Point conversion is shown step by step. The formulas and choosing θ by quadrant are explained with worked examples in the related guide.
Can I download the graph?
Yes, the graph can be downloaded as PNG.
What level are the lessons?
There are 11 guides at beginner, intermediate and advanced level: basics, graphing and calculus (tangents, area, arc length).